3.2.10. Plot line labels
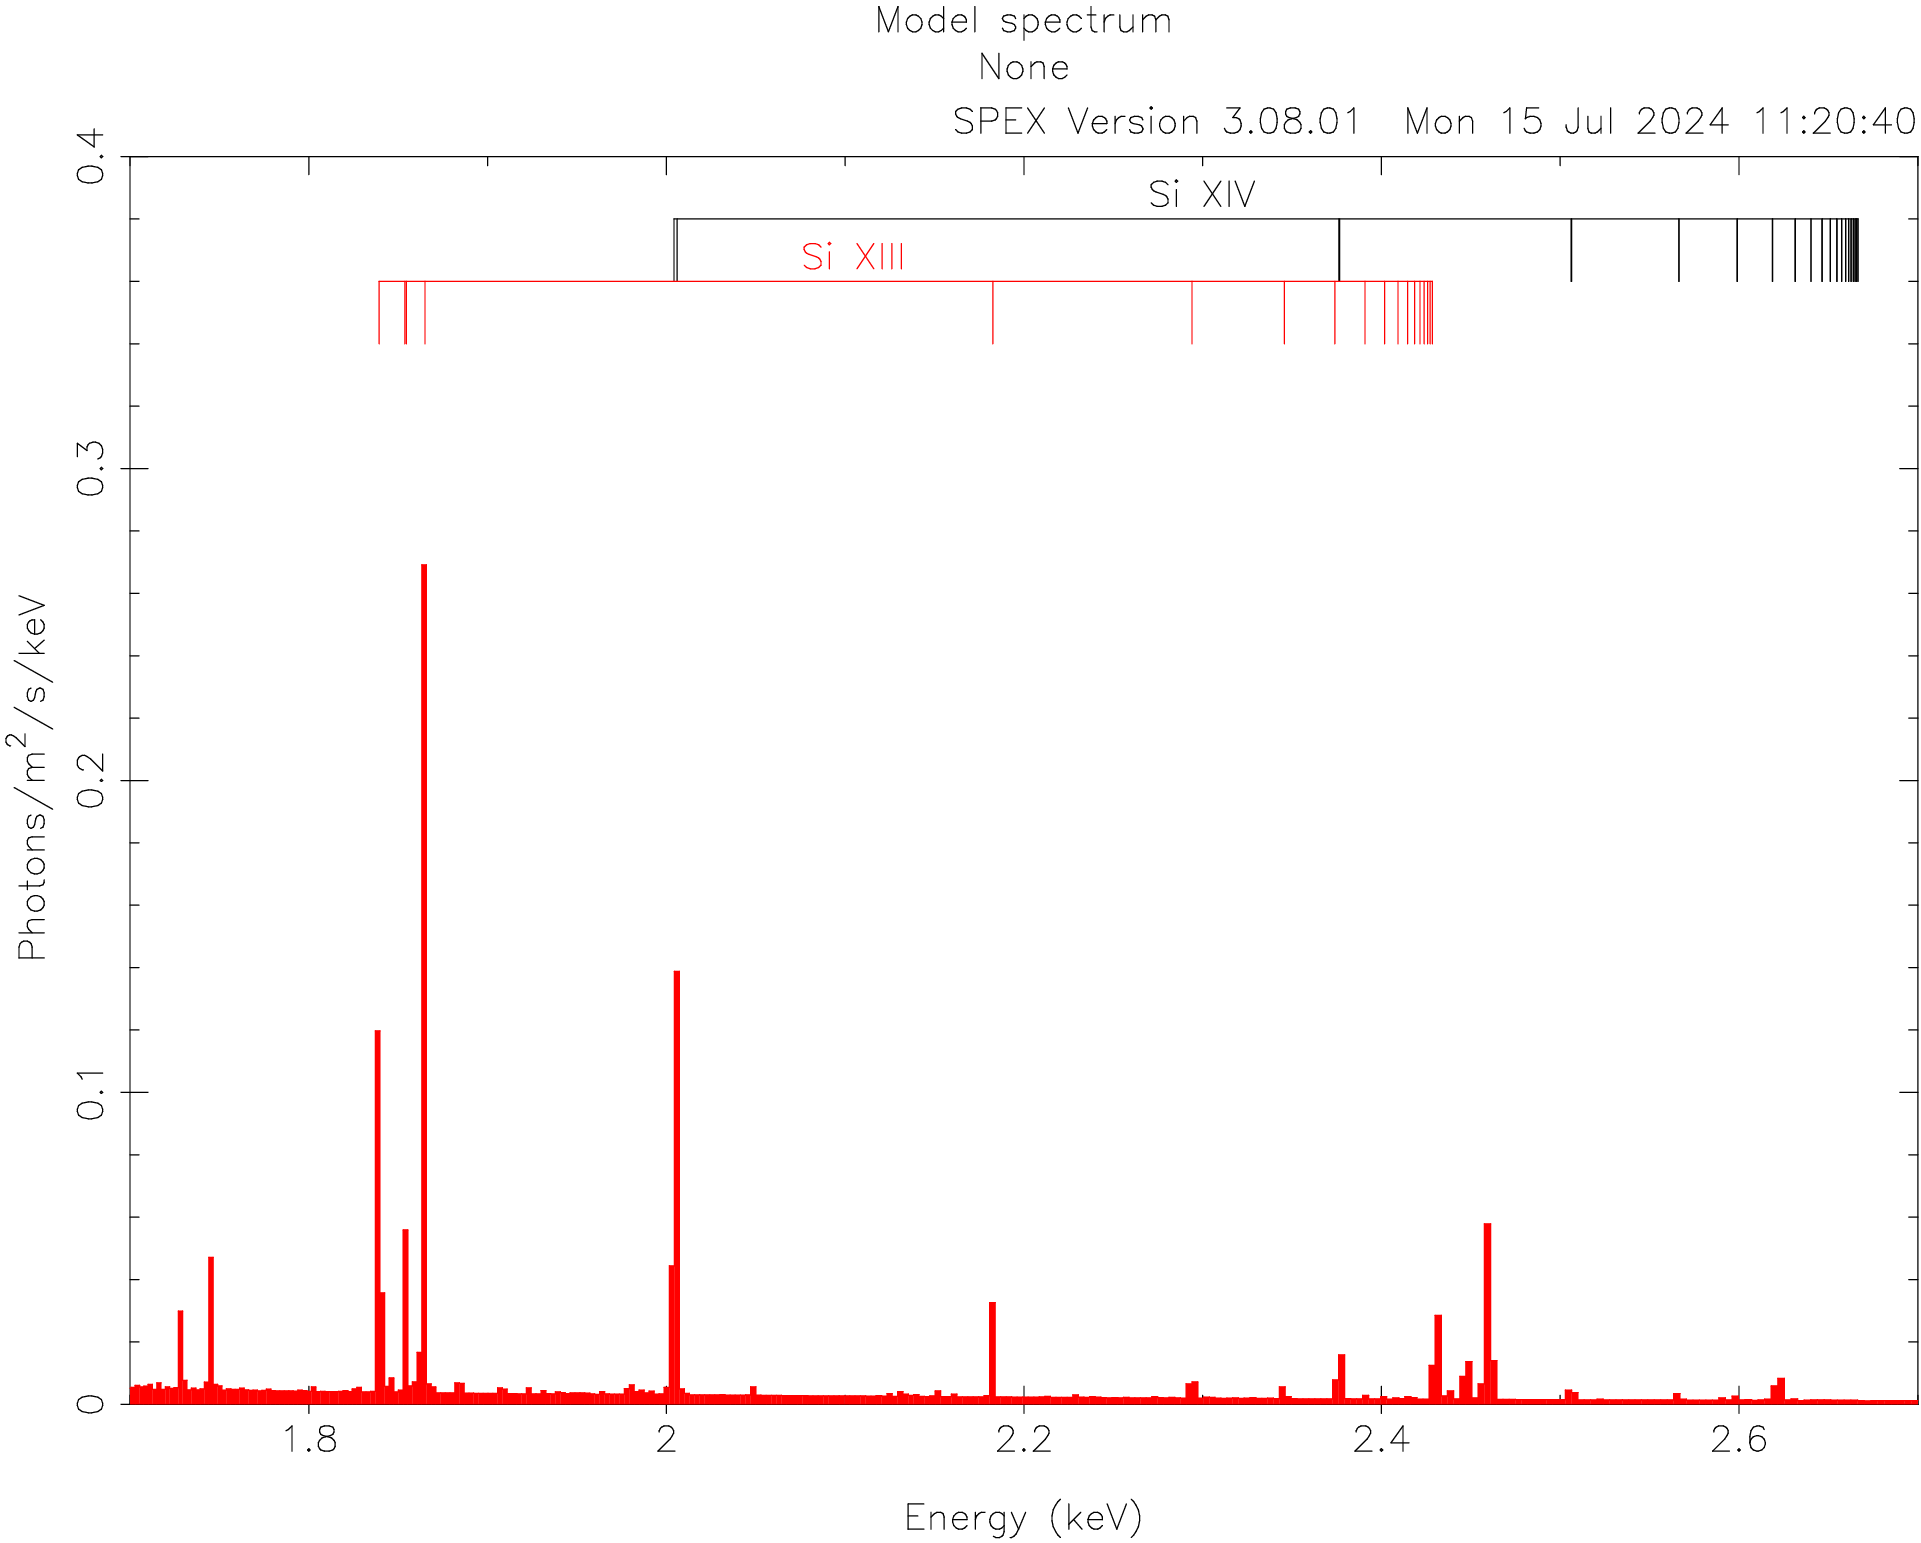
Since SPEX 3.08.01, we have a command to show labels for the strongest lines for an ion. The labels can be added per ion of an element.
3.2.10.1. Example
In the figure below, we add line labels for Si XIII and Si XIV on top of a CIE model spectrum using the following SPEX commands:
# First set the model and create the plot
com cie
var calc qc
calc
plot dev xs
plot type model
plot y lin
plot rx 1.7:2.7
plot ry 0.0:0.4
plot

# Add the line labels
plot ion new 14 14
plot ion new 14 13
plot

# See the result in the figure below

# Delete the line labels
plot ion del

